Sign up for the Family Tree Newsletter Plus, you’ll receive our 10 Essential Genealogy Research Forms PDF as a special thank you!
Get Your Free Genealogy Forms
"*" indicates required fields
Historical maps allow you to step back in time and see your ancestor’s world as he saw it. In this excerpt from our Historical Maps Cheat Sheet, we round up the seven most useful historical maps for genealogy.
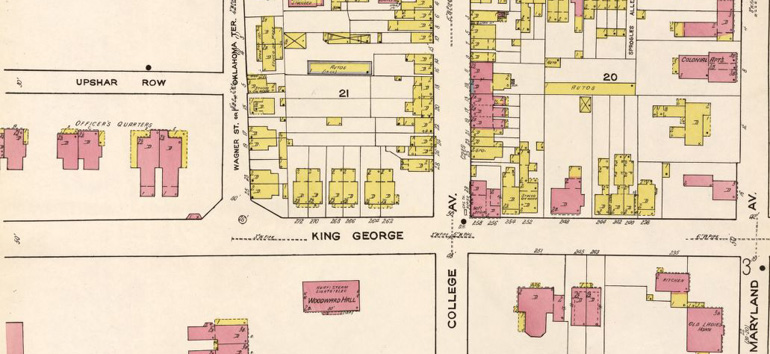
1. Sanborn fire insurance maps
We’ve already covered Sanborn fire insurance maps and how to access them on the Library of Congress’ website. But these maps are worth mentioning again and again. Created for insurance purposes, Sanborn maps distinguish themselves as the most consistent and widely available group of historical maps. They show incredible detail: streets, building owners and even the materials each building was made out of. And because they were created by the same company (the Sanborn Map Co.), they’re often formatted in the same way, regardless of location.
You can find Sanborn maps at the Library of Congress’ website or by researching your local or state archives.
2. Enumeration district maps
As genealogists, we can’t say enough good things about census records. Census records, taken at regular intervals, rank among the most useful genealogical resources because of their consistency. In fact, they often serve as the building blocks for your research, allowing you to trace whole families throughout the decades.
Enumeration district (ED) maps can open new doors for your census record research. Government officials divided communities into EDs to facilitate each census, and these maps can help you determine where to look for your ancestor in the census. If you know your ancestor’s address but can’t find his census record, consult an ED map of the area to determine which ED he would have lived in.
ED maps can also help you learn about the population density in an area. Each ED had roughly the same number of people living within it, so areas with many EDs had large populations. Check out this 1880 ED map from Ohio to see an example.
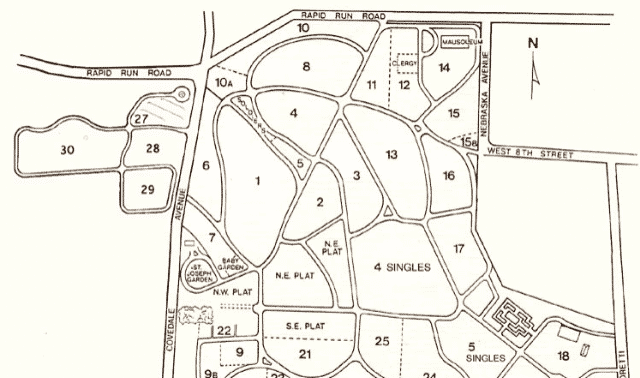
3. Plat maps
Also called cadastral maps or survey plats, these documents helped the government account for and administer land. Plat maps show administrative land divisions and indicate what certain properties were used for. Some plat maps will even list the names of landowners, pointing you towards land records. Learn more about this group of records with our Land Records Cheat Sheet download.
4. Ethnographic maps
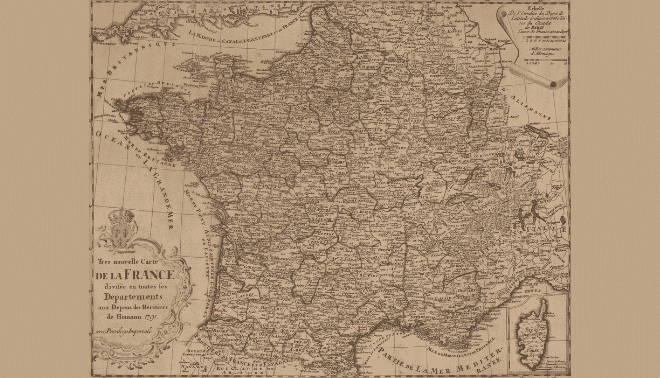
We often think of countries as monoliths, assuming that only one ethnicity lived in a country. This, of course, was not always the case—especially in central and eastern Europe. Austria-Hungray, for example, contained dozens of different ethnicities in addition to Austrians and Hungarians: Germans, Serbs, Croats, Slovenes, Romanians, Romani and Czechs, to name a few.
Ethnographic maps help sort out these complexities by showing what ethnicities made up an area. Generally, each color will represent a different ethnicity or nationality. Atlases often featured these maps, which could cover a whole continent or a single city. Use them to determine if your ancestor was an ethnic minority in his town and (possibly) figure out which language records from the area might be kept in.
5. Topographic maps
In an era before satellites and 3D imaging, map-makers needed a way to show the physical geography of an area on a flat surface. They developed topographic maps to do so. Topographic maps indicate the change in elevation in an area, with lines (called contour lines) indicating levels of elevation. More contour lines in a region indicate more extreme terrain, such as mountains or valleys. These geographic features played an important role in your ancestor’s hometown, and they can help you understand settlement patterns and migration routes.
6. Population density maps
Like ED maps, population density maps can help you better understand the makeup of a community. Different shades of a color indicate how many people live within a certain unit of land–usually, a mile. Darker colors typically indicate more heavily populated areas, helping you identify large urban centers, small towns and other-sized settlements in between.
Government officials often made population density maps based on census data, so look for US maps at 10-year intervals. Like ethnographic maps, population density maps were often included in atlases.
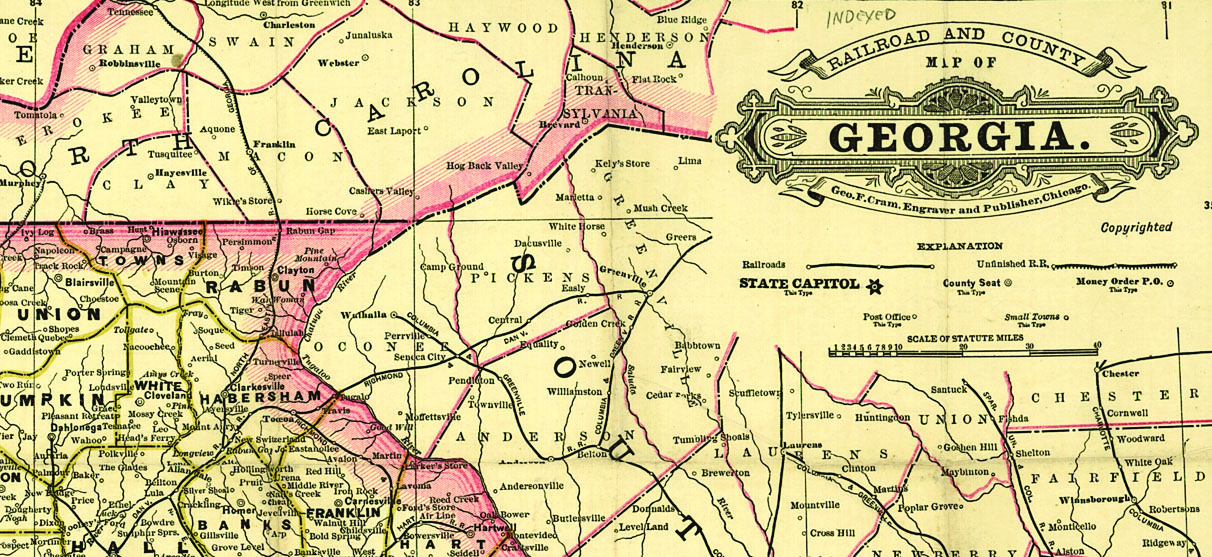
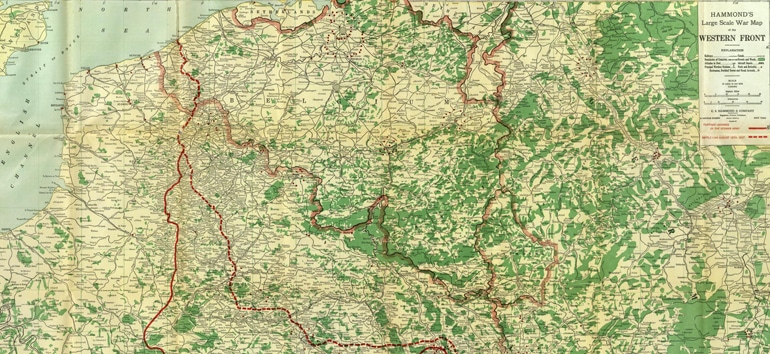
7. Military maps
Maps didn’t just have civilian or business uses—sometimes, they served key roles for the armed forces. Military maps, often created during or just before major battles, helped military leaders plan and strategize for upcoming conflicts. Today, they can help historians set the scene of major military conflicts, from the American Revolution to the Civil War to World War I. In these maps, you’ll find diagrams of troop and regiment movements, plus detailed layouts of surrounding communities. Some maps even have annotations explaining when and where key events (such as the death of a prominent general) took place. If you have military ancestors or ancestors who lived on or near a battlefield, military can provide great detail.
You can find many of the above maps online and for free. The Library of Congress has thousands of digitized maps, as does the David Rumsey Map Collection.
Related Reads


ADVERTISEMENT
Author