Watching Gil Grissom, Catherine Willows and the other science-savvy crime fighters on TV’s “CSI: Crime Scene Investigation,” you might see little in common between their ultra-modern evidence gathering methods and your old-school ways of doing family history detective work. After all, what on earth would a genealogist do with a petri dish, other than use it to store paper clips?
If you go beyond the test tubes and microscopes, however, the connection’s clear: Whether you’re solving a casino murder or searching for Great-great-grandma’s burial site, it’s important to think analytically, use all the tools at your disposal and let the evidence tell the story.
By taking a cue from those “CSI” sleuths—in other words, adopting a “forensic” approach to family history—you can uncover amazing clues to your past. That’s the tactic I’ve taken in my research, and it’s helped me find intriguing ancestral insights, sometimes in odd places. My investigations have led me to study 150-year-old weather records, 1910 Model T sales, the history of bearded ladies in the circus and other unlikely sources.
Eager to start solving your own family history mysteries using the secrets of forensic genealogy? Try these seven techniques for analyzing ancestral evidence.
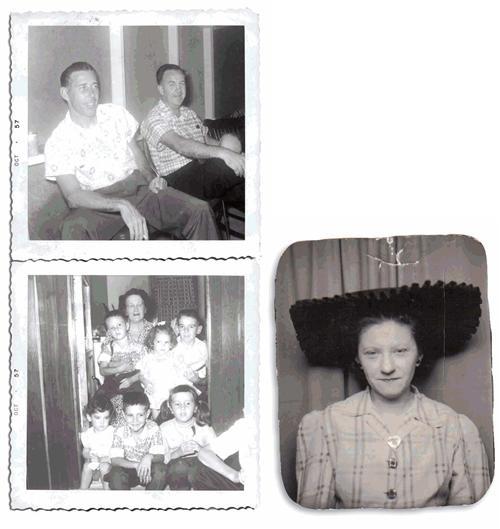
Sometimes the most evident details aren’t the keys to solving a mystery. Consider the above portrait of the woman in the hat. A single feature of the photo gives away the earliest date it could’ve been taken. What do you think it is?
The telltale evidence of this photo’s date is the curtain in the background, which tells us the picture was taken in a photo booth. Since photo booths weren’t introduced to the public until 1925, the picture couldn’t have been taken before then.
Did you home in on that distinctive hat? When I set out to date this picture, I tried researching the headwear myself—without luck. But once I turned my attention to the curtain, the clues fell into place: The drapery style, the photo’s size, the woman’s pose, and her position relative to the camera and curtain were all consistent with other photo booth pictures I compared this one to.
Likewise, don’t overlook a photograph’s potentially helpful physical features—for instance, those crinkly (deckled) edges around mid-20th-century photos. Did you know pictures developed at the same time from the same box of print paper can fit together like a jigsaw puzzle? During the manufacturing process, machines with serrated cutting edges sliced sheets of print paper into smaller squares, which were then packaged together. When a photo lab developed a roll of film, that customer’s prints often wound up on squares cut from the same batch. And you can reassemble the puzzle to find out which pictures came from the same roll. If you can identify people in some of the pictures, you have clues to when, where and why the pictures were taken—facts that can help you identify unknown people in pictures from the same roll.
Here’s an example: I found a picture of two relatives (above) in a box of about 60 family photos. Although I knew many of the subjects’ identities, I had no idea who those men were. By “puzzling” this picture together with other deckle-edged photos in the box, I found a match with a picture of my grandmother’s 50th birthday. I had heard from family stories this special occasion was one of the few times all members of the immediate family were assembled. Through a process of elimination, I identified the people in the pictures and deduced the men had to be my two uncles from New Orleans. My older relatives confirmed this.
2. Collect invisible evidence.
Like criminologists, genealogists should always keep their eyes peeled for missing details. Sometimes the clues you can’t see are as important as the evidence that’s present.
Consider city directories, a staple source for finding out where ancestors lived during a particular period of time. You shouldn’t dismiss names and addresses you don’t find in a city directory: Their absence can help you as much as the ones you do find.
Suppose you’ve tracked an ancestor—we’ll call him John Olson—in Philadelphia city directories for several consecutive years in the 1870s, but he suddenly disappears from subsequent editions in 1875. That might lead you to wonder if he died or moved. Upon closer inspection, you discover this listing in the 1876 edition: “Olson, Elizabeth M. (wid. John).” Now you have evidence that John died between 1874 and 1876.
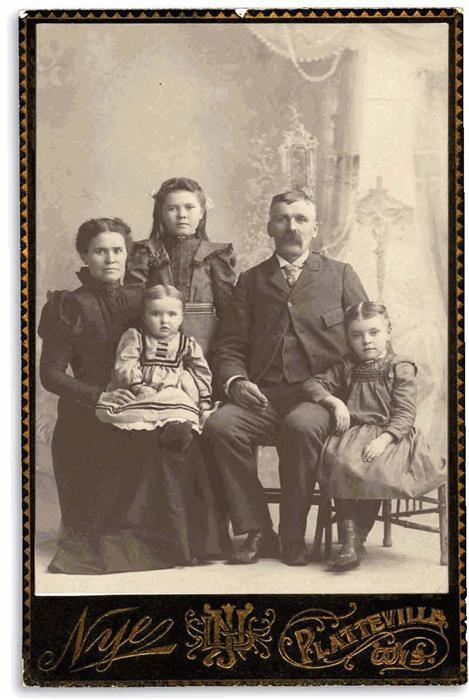
Photos often hold invisible clues, too. Take a look at the family portrait of five (above). After studying this 19th-century cabinet card, I surmised that the couple probably had at least five children. Why? During this period, couples commonly had kids about every two years, but the children in the picture are obviously more than two years apart. A note on the back of the photo gave the children’s ages 1, 5 and 11. So the parents easily could’ve had one child between the toddler and 5-year-old, and two between the 5-year-old and 11-year-old.
To see if these age gaps were indeed invisible evidence of other offspring, I researched 1890s birth and death records for Planteville, Wis., the town shown on the photographer’s imprint—and learned the couple had at least three additional children.
3. Scrutinize every suspect.
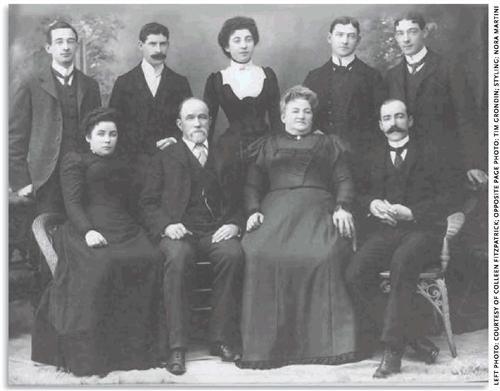
This type of thorough investigation helped me discover a piece of family health history from an ordinary portrait. The picture above picture shows my great-great-grandparents Peter and Mary (Hanlon) Fitzpatrick surrounded by some of their children. One of those pictured has a serious medical problem. Do you know which one, and can you diagnose the problem? (No, it’s not the woman in the back row wearing the strangulation corset.) Don’t peek until you’ve taken a good look at each person.
The answer: My-great-great-grandmother, the elderly woman in the front row, has had a stroke. My family doctor first identified her symptoms—in particular, the left side of her face is paralyzed. She’s also propped up in a chair or a wheelchair; see how much higher her waist is than that of her husband, as well as the others seated in the front row? Notice, too, that the other chairs are visible, but the old woman’s clothes seem carefully arranged to hide hers.
This discovery led me to look for hospital records. Because they’re often privately held, hospital records can be tough to get, but I was lucky: The Church of Jesus Christ of Latter-day Saints’ Family History Library <www.familysearch.org> had microfilmed the admission documents from New Orleans’ Charity Hospital, the nearest one to the Fitzpatrick family’s residence. So I ordered the microfilms to view at my local branch Family History Center.
I’m still looking through the admission records to find out when she might’ve been admitted—and establish the earliest possible date for the picture. Based on the style of the photograph and the apparent ages of the couple and the children, I’ve narrowed my target time frame to the 1890s and early 1900s.
4. Add up details to reconstruct the scene.
We’re all familiar with large record collections such as censuses, city directories and birth and death certificates—we use these sources to find specific information about someone. But when you look at such records as a set instead of individually, you can go beyond the strict genealogical facts to get a much richer picture of your ancestors’ lives and times.
For example, suppose several of your ancestors died in a small town. As long as you’re looking through the records to find death dates, why not check out how many of the town’s residents died each year? An unusually high number could indicate an epidemic. You can take this a step further and look at birth (or baptismal) records, too. If the town’s death rate didn’t spike but its number of surnames dwindled to only a handful, this should raise suspicion: Did something prompt families to migrate out of the area?
To show how you can put this principle into action, let me share another example involving hospital admission records. When searching for Great-great-grandma’s admission to Charity Hospital (see tip 3), I decided to investigate the entire collection for clues about the lives of local Irish immigrants in the early 1850s.
Charity Hospital was established in 1736 to offer free medical care to the indigent. (It’s now called the Medical Center of Louisiana at New Orleans.) During the early 1850s’ about 80 percent of incoming patients were Irish famine immigrants who couldn’t afford to pay.
Tallying daily admissions might sound tedious, but it was actually easy to do as I was scrolling through the microfilm: Each page in the admissions book had space for 50 names, so all I had to do was count the blank lines at the end of a page, or names overflowing onto the next.
The number of admissions varied over the year, with most patients arriving in mid-August—typically the hottest, wettest time of the year in New Orleans. I suspected that increase was weather-related, so I requested 1850s temperature and rainfall records from Louisiana’s state climatology office <www.losc.lsu.edu>. Those records confirmed my theory: The number of admissions rose and fell in synch with the rainfall, but with a lag of three weeks.
So what tied the Irish residents’ illnesses to the city’s amount of rainfall? And what’s the significance of the three-week lag?
History provided the answer. The Irish arrived as free but destitute, willing to do anything to earn even a small amount of money to survive. So to avoid risking the lives of slaves, who were worth a small fortune, employers hired the Irish immigrants for the most dangerous jobs—such as digging drainage canals to increase the amount of inhabitable land in New Orleans. They often labored for hours in standing water, prime breeding conditions for mosquitoes carrying yellow fever. The mosquitoes’ breeding cycle could account for the three-week lag between the rain and the surge in hospital admissions.
Comparing admissions to rainfall for three consecutive years (1851 to 1853) corroborated my suspicions. In fact, a catastrophic yellow-fever epidemic decimated the Irish population in 1853. I wasn’t surprised to learn the city received three times its normal rainfall that July, and hospital admissions soared in early August.
Of course, you don’t necessarily have to chart rainfall totals or hospital admissions to reconstruct the scene of your own family’s history. If you’re looking at a set of records and notice a trend, try investigating online and in historical sources for clues to events that affected your family. Which leads us to our next technique …
5. Stay hot on the trail using social history.
Of course, written records reach back only so far—and when the document pool dries up, it’s tough to trace your family’s origins. But by looking at the available records collectively (as described before) and studying social history, you can glean clues to how long your ancestors had lived in an area, where they might have come from, when they arrived and what their lives were like.
My Ulmer ancestors lived in a small village in Alsace, an area of France, during the mid-1600s. Many Ulmers reside there today, so I was surprised to find only one Ulmer family—a father, mother and their six children—in the city of Sigolsheim at that time. Sigolsheim’s parish registers start in 1664; earlier vital statistics weren’t recorded. So birth years for villagers born before 1664 can be derived only from their ages and dates of death.
I thought this was the end of the road. But the village’s birth and death records held two surprising clues. Based on the ages of the Ulmer mother, Anna, and her children, I realized Anna would’ve had her first child in her 30s—which I thought unusual for a farming community, where women would often marry in their early 20s and sometimes bear children until their early 50s (if they lived that long). Did she have any older offspring? I wondered. And if so, what happened to them?
I also observed curious demographics in Sigolsheim’s overall population. The birth and death records indicated two distinct age groups: half were adults (parents), and half were about 20 years younger (their children). Hardly any residents’ ages fell into the 20-year gap, and the town had very few elderly people. In essence, the city consisted almost entirely of young families.
I could think of only one reason for this: The people in the village had recently arrived together in a group, perhaps as a refugee party. To explain the absence of older children in that 20-year gap, I guessed the families had left their adult children behind. Assuming these missing children had been 18 or older, I estimated the people moved into the area in the early 1650s.
What was going on about that time? I researched European history and found out that in 1648, the Peace of Westphalia ended the Thirty Years’ War in Germany and transferred Alsace to France. Advancing and retreating armies had left much of southwestern Germany in ruins. The devastation prompted residents to abandon wrecked villages for better opportunities elsewhere—so perhaps the Sigolsheim residents were part of that migration.
In researching the earliest Sigolsheim residents’ surnames, including Ulmer, Saltzmann, Brodbacher and Nagler, I learned they were all common in southern Germany during the mid-17th century. Further, the villages where I found those names all sat on a path through southern Germany to Strasburg, where the party probably crossed the Rhine River into France.
So I’ve now started searching for my Ulmers in southern Germany. If I find them, I’ll recognize them immediately, as I know names and approximate birth years for the parents and their six youngest children.
6. Confirm (or disprove) your suspicions with DNA.
With the growing popularity of genetic genealogy, science has become a bigger part of roots research than ever before. Thus far, genealogists have concentrated on finding genetic matches within specific surname groups—but that focus is beginning to change.
Online databases of Y-DNA test results, including Ysearch <www.ysearch.org>, Ybase <www.ybase.org> and the Sorenson Molecular Genealogy Foundation (SMGF) project <www.smgf.org>, are growing at a great rate, allowing genealogists to find matches they’d otherwise never have known about.
My brother Terry is a great example of how a database can successfully lead to a match with a different surname (or surnames). We’ve enrolled 75 Fitzpatricks in our study, but Terry hasn’t matched anyone. With the 26-marker test Terry took, men typically must share at least 23 markers to be considered a “match”—and Terry’s results are five mismatched markers away from the closest participant’s.
When I entered Terry’s Y-DNA values into Relative Genetics’ Y-match database <www.relativegenetics.com> (available to registered users), I found a near match within the Scottish Clan study. The Web site didn’t provide a name, so I contacted the study’s administrator. She told me she maintains her own database of 1,100 Scottish descendants whose DNA test results are posted at Ysearch, Ybase and Relative Genetics’ site. Using her Scottish database, I found more leads—including a 24/25 match to a Moffet and an exact match to a participant named Henry Logan.
Our most-distant known Fitzpatrick ancestor came to the United States in 1849 from County Louth in northeast Ireland, so those links to the Scottish study participants were a surprise—and they hint at a new possibility to investigate: Perhaps our Fitzpatricks originated in Scotland. By comparing Terry’s results with other Scottish surname studies’ participants, or including people with Scottish ancestry in our own study, we’ll get a better idea whether we’re headed in the right direction.
Remember tip 1, about looking beyond the obvious? It applies to genetic genealogy, too: When you start a DNA study, you’ll probably focus on finding participants in obvious places; for instance, the US regions where immigrants of your ancestors’ ethnicity settled, or their areas of origin. But as your DNA study grows, try looking for potential participants who live in “unconventional” locations—such as less-common immigrant destinations—to see if any interesting links turn up.
You can use history as your guide: For example, Irish researchers could look for family links in France (where some Irish Catholics relocated following the Protestant victory at the 1691 Siege of Limerick) or Argentina (a destination for an estimated 40,000 potato famine immigrants). Likewise, some Germans immigrated to South America. English—ancestored researchers could seek out genetic-genealogy leads in India, and Dutch descendants might try Taiwan, which the Netherlands occupied from 1641 to 1662. By expanding your search to include off-the-beaten-path locations, DNA can give you a larger picture of how your family fits into world history.
Not only can history hint at genetic links, DNA can point to a previously unrecognized episode in your family’s past. “Oddball” test results sometimes signal nonpaternity events (adoptions, name changes, illegitimacies), which can link you with unexpected people and places.
To illustrate this, let’s go back to my Fitzpatrick study. Although the DNA profiles (haplotypes) in our study are relatively diverse, most participants match one another on 20 or so markers out of 26. This shows that we share a common background—it’s just far back in the past. Three people don’t fit that mold, however: They match the rest of the group on no more than seven markers.
Two of these three men—a Catholic priest from New Jersey and a retired engineer from New South Wales, Australia—match each other exactly. And they’ve traced their families back to two small towns only 10 miles apart on the west coast of Ireland. The American’s Fitzpatrick family immigrated during the Great Famine; the Australian’s Fitzpatrick ancestors went “down under” in the early 1900s. How could these men match each other exactly but be so different from the rest of the Fitzpatrick study group?
Our questioning has led to some interesting theories, developed from what we know about the history of western Ireland. One potential explanation is that the men descend from a Viking who made a pit stop on his way around coastal Ireland, leaving behind a genetic souvenir. Another possibility: The pair descends from a survivor of the Spanish Armada’s 1588 wreck on the west coast of Ireland. As online databases grow to include a more diverse collection of haplotypes, we may well find more matches to these men. If they match an Erikson or a Peterson, we can further probe the first possibility. If they match a Lopez or Garcia, can explore the second theory. Or we may end up devising altogether new theories. But whatever we discover, they’ll have a fascinating new chapter to add to their family sagas.
Evidence of a Connection
Genealogists are like scientists without the lab coats: Our lives revolve around research, and we don’t accept assertions willy-nilly. In fact, family history generally follows the age-old “Scientific Method” you learned in grade school:
1. State the problem. The first step toward genealogical progress is determining which puzzle you want to solve: Great-grandma’s maiden name? Great-grandpa’s birth date? How many children they had?
2. Form a hypothesis. To focus your research, you’ll need to make some educated guesses based on the facts you already know. Say Great-grandma and Great-grandpa’s farm sits next to one occupied by Horatio and Hyacinth Hipperniggle. If your ancestors have a son named Horatio and a daughter named Hyacinth, you’d suspect a connection: Perhaps Great-grandma was born a Hipperniggle.
3. Test your theory. To investigate this hypothesis, you’d study all the records of Horatio Hipperniggle you can get your hands on to see if Great-grandma’s mentioned anywhere.
4. Draw conclusions. Sure enough, Horatio and Great-grandma both appear in the will of Herman Hipperniggle, their father. This evidence supports your hypothesis.
5. Report your results. Now you can add Great-grandma’s maiden name—as well as your newfound great-great-grandfather Hipperniggle-to your pedigree charts and genealogy software.
Gram Crackers
Find tables of genetic marker values confusing (and who but the “CSI” crew doesn’t)? When you’re trying to make sense of DNA results for a surname study—or figure out where you fit in—a cladogram can help.
Cladograms (also called “phylogenetic trees”) are akin to pedigree charts, but instead of illustrating generational relationships, they show genetic ones. Each open circle in a cladogram represents one (or more) participant’s haplotype, or specific set of marker values. The more participants who share a haplotype, the bigger the circle. Links between circles indicate markers where the haplotypes mismatch; again, the more mismatched markers between two haplotypes, the longer the line between two circles.
For example, this cladogram of the Mumma surname study results shows how DNA distinguishes the three branches of this family according to the unique mutations they show. The top branch (L) represents relatives of Leonard, who came to the United States in 1751; the middle branch (P) shows participants linked to Peter, who arrived in 1748; and the bottom branch (J) denotes descendants of jacob, who immigrated in 1720. As new participants join the Mumma study, it’s easy to assign each to his correct family branch based on which mutations he has.


