
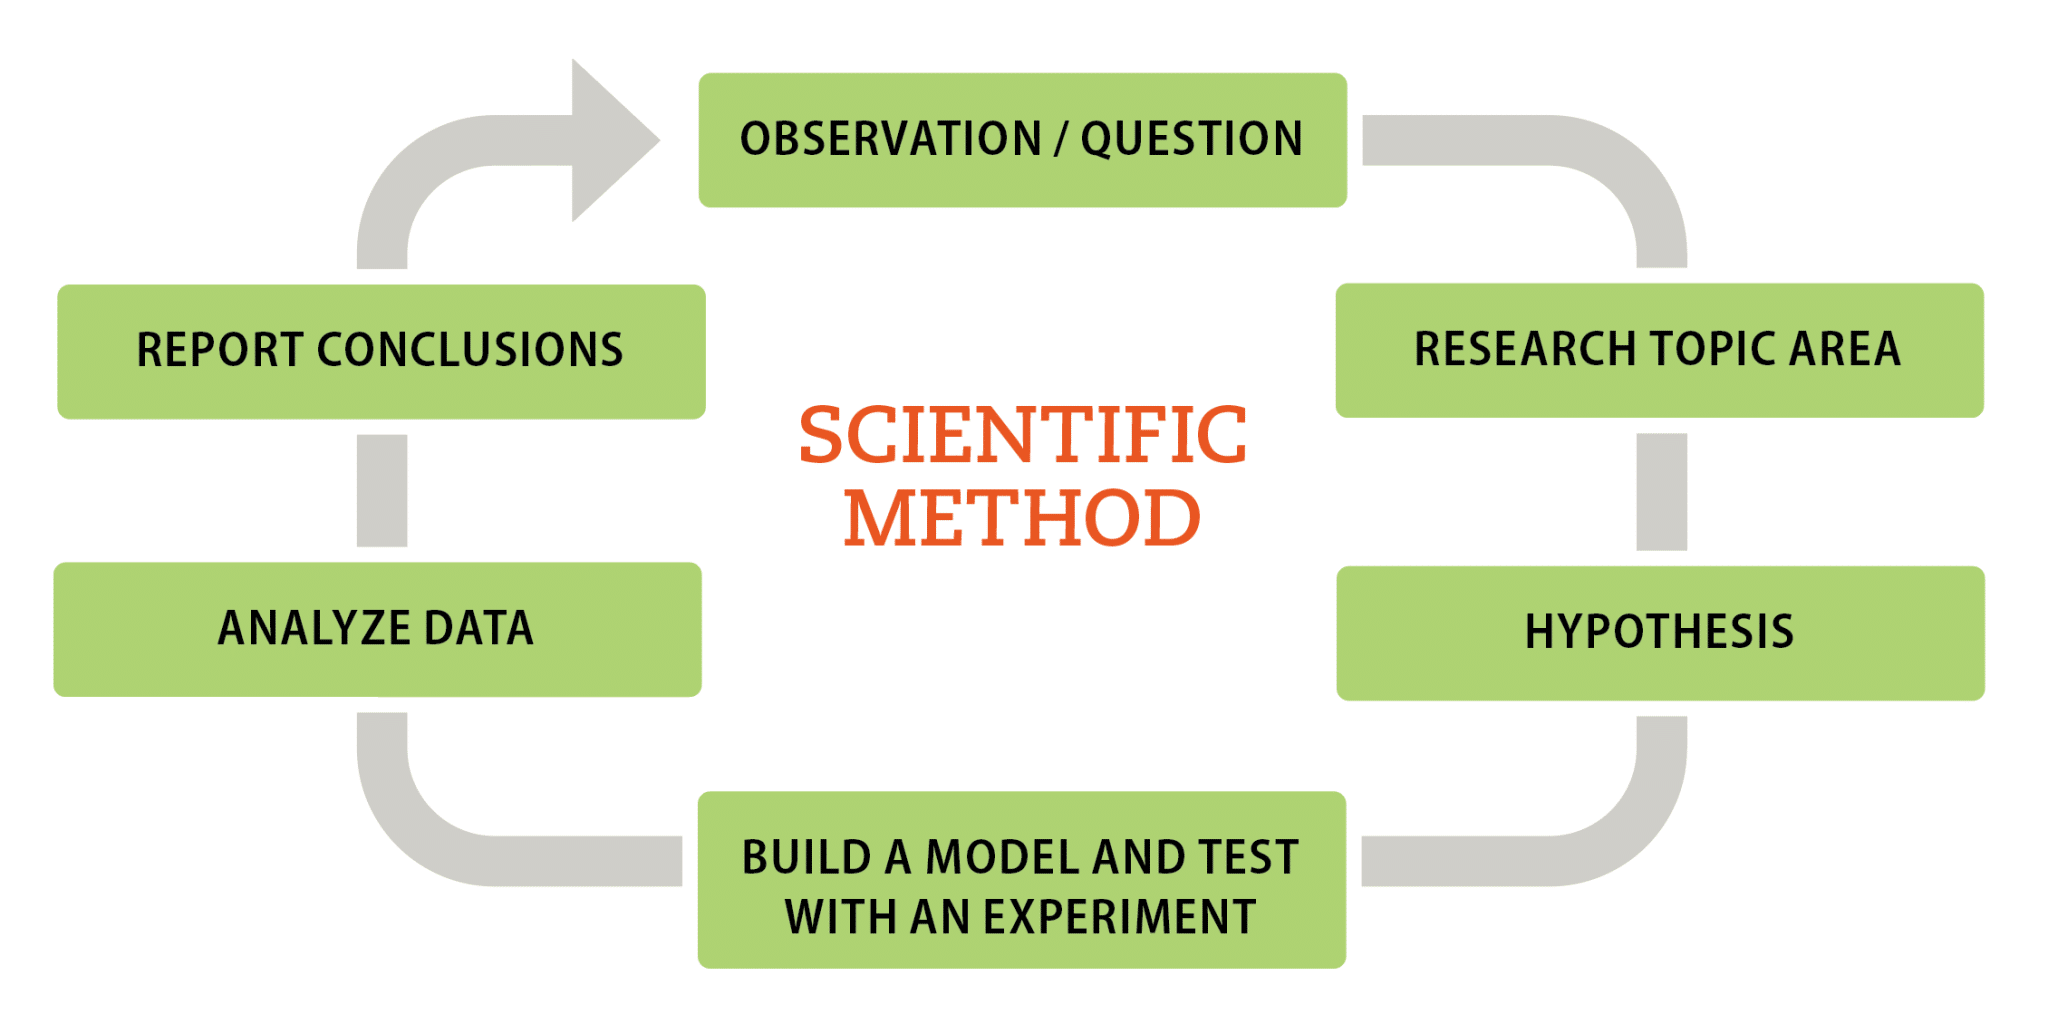
Through the scientific method, researchers walk through a series of prescribed steps to solve a problem: asking a question, collecting data, developing a hypothesis, building a model and running an experiment that tests the hypothesis, then analyzing data and drawing conclusions based on results.
And because genealogy is derived from the word “theory” or “science,” it stands to reason that professionals can use the time-tested scientific method to investigate genealogical mysteries as well as physical ones. In fact, the genealogy industry has developed its own version of the scientific method: the Genealogical Proof Standard (GPS).
When the paper trail comes to an end—as it always does—DNA testing can help establish familial relationships for which no records exist. Fortunately, the scientific method (figure 1) can be applied to both traditional ancestral research and to genetic genealogy.
In this article, I’ll demonstrate how to use the steps of the scientific method to help solve a genetic mystery: how two unknown DNA matches and I are each related to a most-recent common ancestral couple. As we’ll see, successful DNA analysis relies on accurately sourced family trees, as well as a correct understanding of DNA test results.
To begin, have your autosomal DNA (atDNA) tested at one of the big companies: 23andMe, AncestryDNA, FamilyTreeDNA and MyHeritage DNA. You should also encourage other relatives to test: parents, siblings, aunts, uncles and especially cousins (the closer, the better). If possible, request that they allow you to manage their results.
Test at multiple companies or upload your results from one service to another; by tapping into more databases, you’ll maximize the number of potential relatives. You can also upload results to third-party websites such as GEDmatch, which have their own user bases and analysis tools.
1. Make Observations and Ask Questions
Scientific inquiries are sparked by something you notice, which leads to a question.
I’ve been researching my immigrant great-great-grandfather’s parents, to no avail. I hoped that DNA testing could shed light on the mystery, so I tested my DNA and uploaded results to multiple websites. Some of my reported DNA matches share a “genealogical” amount of DNA with me, meaning I can feasibly determine who our most-recent common ancestor (MRCA) is.
The sites’ shared matches tools, in particular, provide valuable information. They allow you to identify test takers who are related to each other, in addition to you. By combining shared DNA data with verified ancestral documentation, you can determine how matches who share a known ancestor might also relate to an unknown ancestor.
As I reviewed my DNA matches, I noticed two of them who seemed to be related to each other as well as to known relatives of my great-great-grandfather. That was my spark: Could these matches also be related to my great-great-grandfather?
2. Research the Topic Area
Next, do some initial research into the related subject. This will form the basis of your hypothesis, a potential solution to your question.
By digging more into the shared matches tool, I learned the following:
- Two test takers, who we’ll call Target Matches A and B, descend from a known ancestral couple.
- Based on DNA and family trees, A and B are second cousins to each other; they share great-grandparents as their MRCA.
- A and B share DNA with me and many known family members on my great-great-grandfather’s line.
Based on our estimated genetic relationships, the MRCA that I share with A and B share is one generation beyond my known family line. And genealogical records indicate all of our ancestors lived in the same part of Europe at the same time.
3. Form a Hypothesis
Based on available evidence, come up with a plausible, testable solution to your research question. For me: “My great-great-grandfather was a brother to A and B’s great-grandfather.”
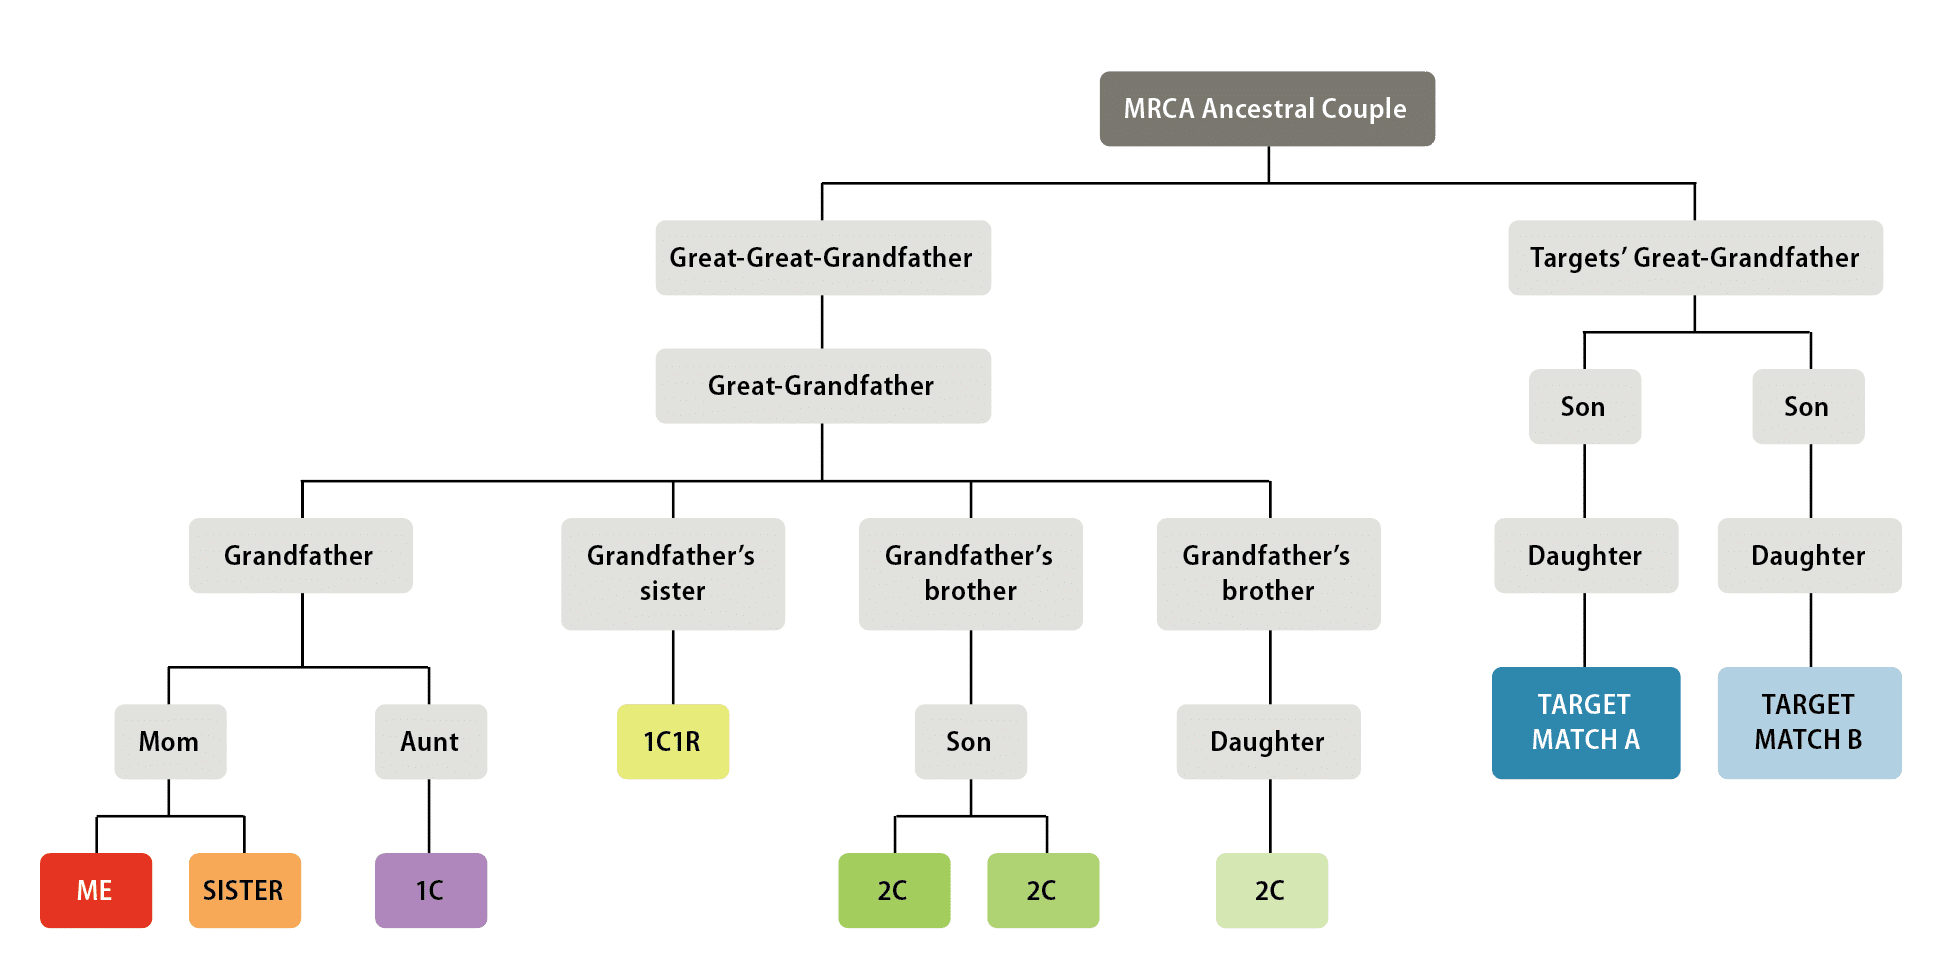
Next, build a testable model that represents your hypothesis. This will be the framework through which you’ll run your experiment. Because my hypothesis is that A, B and I all share an ancestral couple as our MRCA, my model is a descendant tree with that couple at its peak (see figure 2). If my hypothesis is correct, the couple would be my third-great-grandparents and A and B’s great-great-grandparents.
4. Test, and Gather Data
Your experiment should generate data that will provide evidence for or against your hypothesis. In terms of DNA testing: Relatives share a somewhat predictable range of DNA (measured in centimorgans, or cM). If my hypothesis were true, it would be reflected in how much shared cM various known relatives have with each other and with A and B.
To get this information, we’ll need the testing company to provide specific cM values between shared matches. Fortunately, MyHeritage DNA provides this, making data-collection easy. I viewed and recorded the shared-cM values between me and my various matches (including Target Matches A and B), then compiled them into a matrix table:
| Me | Sister | 1C | 1C1R | 2C | 2C | 2C | Target A | Target B | |
|---|---|---|---|---|---|---|---|---|---|
| Target A | 119.5 | 88.8 | 70.5 | 58.4 | 49.6 | 33.6 | 0 | n/a | 180.8 |
| Target B | 40.1 | 34.1 | 56.5 | 101.9 | 88.5 | 46.6 | 28.1 | 180.8 | n/a |
Next, I used various tools at DNA Painter to determine if these cM values could plausibly reflect my hypothesized descendant chart:
- The Shared cM Project for determining the most-likely relationships based on cM values
- The What Are the Odds (WATO) tool for evaluating the likelihood of various relationships
- DNA Painter for chromosome-mapping and triangulation that confirms common ancestor(s)
To begin: My hypothesis predicts that my sister, my first cousin (1C), my three second cousins (2C) and I are all third cousins once removed (3C1R) with A and B. My first cousin once removed (1C1R) would be A and B’s third cousin.
The Shared cM Project was created to study the connection between genealogical relationships and shared DNA. It’s continually updated, and reports the expected cM value shared between two people of a known relationship—both the average and the reported range.
From the main page, click a relationship to view a histogram that visualizes the distribution of cM values. From the Shared cM Project’s data, I learn that those two relationships have the following amounts of shared cM:
| Average (mean) cM | Observed cM Range | Standard Deviation* | |
| 3C1R | 48 cM | 0 to 192 cM | 32 cM |
| 3C | 78 cM | 0 to 234 cM | 43 cM |
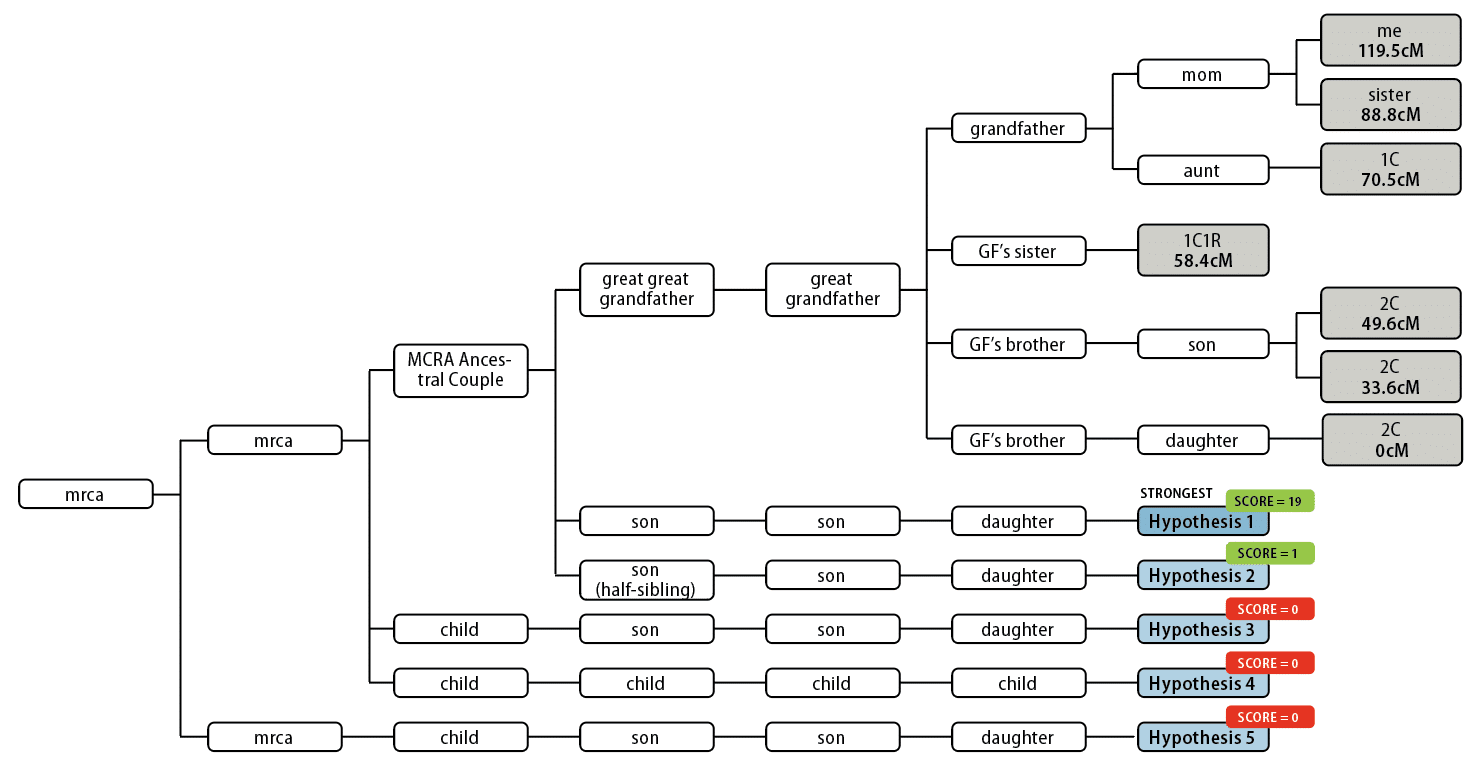
Next, I used DNA Painter’s What Are the Odds (WATO) tool. Given known relationships and shared cM values that you organize into a family tree, the tool generates hypotheses for how one target individual is related to the others.
WATO’s hypotheses are given a score based on their likelihood. A score of 0 means the hypothesis is impossible, and a score of 1 or higher means it’s possible. In situations where there are multiple possible hypotheses, scores reflect that hypothesis’ likelihood relative to the hypothesis with a score of 1. Higher scores mean higher likelihood.
For example, say the tool generates three hypotheses that have scores of 100, 5 and 1. The score-100 hypothesis is 100 times likelier than the 1-score hypothesis, and 20 times likelier than the 5-score hypothesis.
I had the WATO tool generate hypotheses for both Target Match A and Target Match B. Each resulted in a few possible hypotheses: two for Target A, and three for Target B.
Finally, I used DNA Painter’s chromosome-painting and atDNA segment triangulation tools. These report on specific segments of DNA that a group of matches share in common with each other. Larger shared segments correspond to recent shared ancestry.
The tool reports that my 1C, one of my 2Cs, Targets A and B, and I all share a 26.5-cM segment on chromosome 2. It also identified a 16.1-cM segment on chromosome 18 that my 1C, one of my 2Cs, Target A and I all share.
5. Analyze Data
Evaluating your model is the single-most important element of scientific methodology. Your hypothesis should satisfy the question-answer on all levels through an “if this, then that” format. In this case: “If Target Match A, Target Match B and I descend from the hypothesized ancestral couple, then the shared-cM data should be consistent with predicted relationship levels.”
Based on the data from your experiment, you determine whether to accept or reject the model. If you reject the model, you’ll create a new one, then apply it in another experiment.
As a reminder: If the hypothesis were true, then A and B would be 3C1R to me, my sister, my first cousin and my three second cousins. Based on the Shared cM Project’s data, we would each share about 48 cM with A and B, with a standard deviation of 32 cM.
Comparing the matrix pulled from MyHeritage and the Shared cM Project, I observed that eight of the 12 predicted 3C1R relationships share between 16 and 80 cM with Target Matches A and B, meaning they’re within one standard deviation of the average cM value. Three others fall within two standard deviations (e.g., between 0 and 112 cM), and a fourth lies just outside at 119.5 cM.
That’s significant. In statistics, the “Empirical Rule” states that a normal distribution of data has 68% of data points within one standard deviation, and 95% within two standard deviations. In our experiment, 66.7% (eight of 12 relationships) were within one standard deviation and all but one of them (91.6%) were within two. That distribution nearly follows the Empirical Rule, thus supporting our hypothesis.
The WATO tool also supported the model hypothesis. For both Target Matches A and B, the tool’s most-likely hypothesis was the one in which my great-great-grandfather was a sibling to A and B’s ancestor: a 19:1 ratio for A and a 7:1 ratio for B.
Finally, the chromosome-mapping and atDNA triangulation tools found two large, triangulated segments between me, two known family members, and both A and B. That means a common ancestor is highly probable.
6. Report Conclusions
Consider what broader implications your results have. In this case, the experiment reinforced that genetic genealogy can add to your research even once the paper trail has ended.
DNA doesn’t lie, but it does rely on proper understanding of results and analytical tools. Using rigorous standards that prioritize analysis and correlation of data (such as the scientific method and the GPS), you can apply DNA test results to your research and provide conclusions with reasonable certainty.
Related Reads


You’ve got a limited DNA testing budget but lots of relatives. How do you decide who should be next to test? We’ll show you two ways to create your genetic genealogy testing strategy.

A version of this article appeared in the July/August 2023 issue of Family Tree Magazine.