Sign up for the Family Tree Newsletter! Plus, you’ll receive our 10 Essential Genealogy Research Forms PDF as a special thank you.
Get Your Free Genealogy Forms
"*" indicates required fields
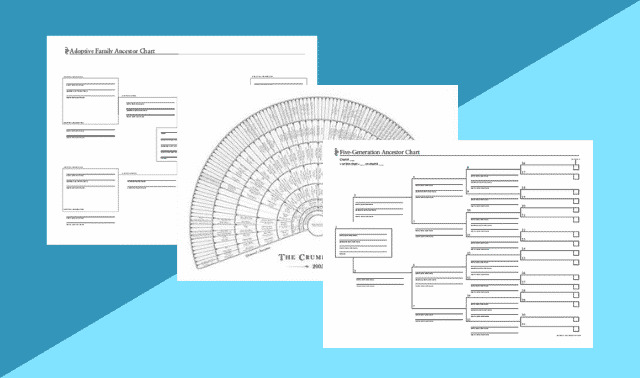
How do you know which family tree chart is right for your genealogy goals? What’s the difference between all those options in your genealogy software? And what the heck is an Ahnentafel, anyway?
Here’s a quick guide to some of the most popular family tree chart types and terms. Brush up on your knowledge, then download your free family tree template and get charting!
Note that some of these chart names reflect usage in specific genealogy software programs, some of which have been discontinued or made obsolete by more-recent releases. Modern desktop programs likely have similar chart options, albeit with different names.
Jump to:
Ahnentafel Numbering
All-in-One Tree
Ancestor Tree
Cascading Pedigree Charts
Descendant Report
Descendant Tree
Family Group Record (or Sheet)
Family History Report
Fan Chart
Genealogy Report
Hourglass Tree
Kinship Report
Life Bar Chart
NGS Quarterly Report
Outline Descendant Tree (or Chart)
Pedigree Chart (or Ancestor Chart)
Register Report
Timeline Chart
Tiny Tafel Report
Waterfall Chart
Ahnentafel Numbering
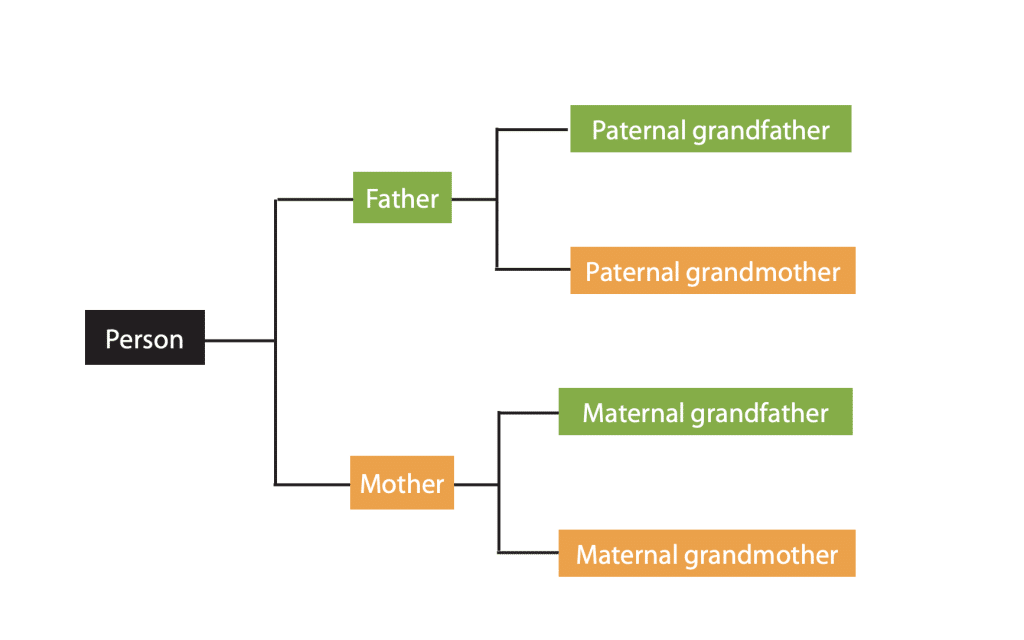
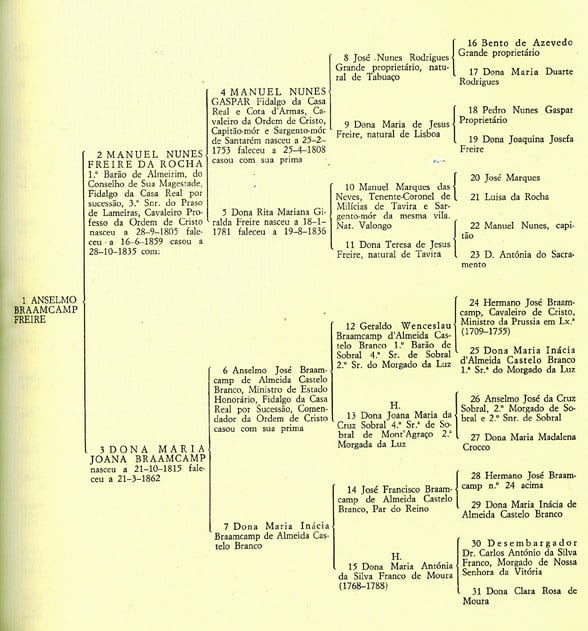
Used in pedigree charts and ancestor-oriented genealogy reports, the Ahnentafel numbering system gives unique numbers to the starting person and each ancestor. (Ahnentafel means ancestor table in German.) Double a person’s number to get the father’s number and add one to the father’s number to get the mother’s number.
All-in-One Tree
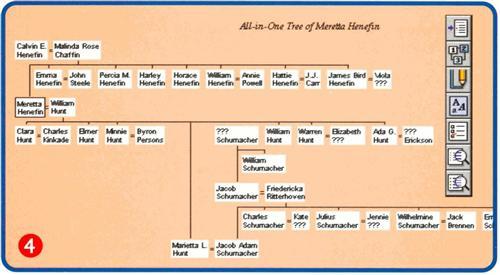
This chart in Family Tree Maker shows everyone in your file, including ancestors, descendants and cousins. It’s great for visualizing everyone at once, but quickly becomes confusing as your family file grows larger.
Ancestor Tree
Shows a person’s ancestors. Family Tree Maker provides three forms:
- The standard version is compact and shows the starting individual at the left and the ancestors branching off to the right.
- The fan chart shows the starting individual in the middle of a circle and the ancestors branching out in all directions. You can also select half-circle and quarter-circle variations.
- The vertical ancestor tree shows an individual’s ancestors branching upward.

Cascading Pedigree Charts
Several programs can print a series of numbered pedigree charts showing a person’s ancestry. It’s faster than printing one chart at a time and the chart numbers are calculated automatically.
Descendant Report
Similar to an Outline Descendant Chart (below), the Descendant Report in Generations also includes dates and places of birth, death and burial. It’s useful as a compact format for displaying detailed information on a person’s descendants.
Descendant Tree
Family Tree Maker provides two forms:
- The fan chart shows the first generation as the center circle and each generation of descendants branching outward in a larger circle, half-circle or quarter-circle.
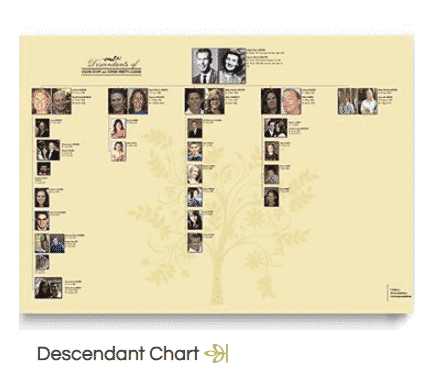
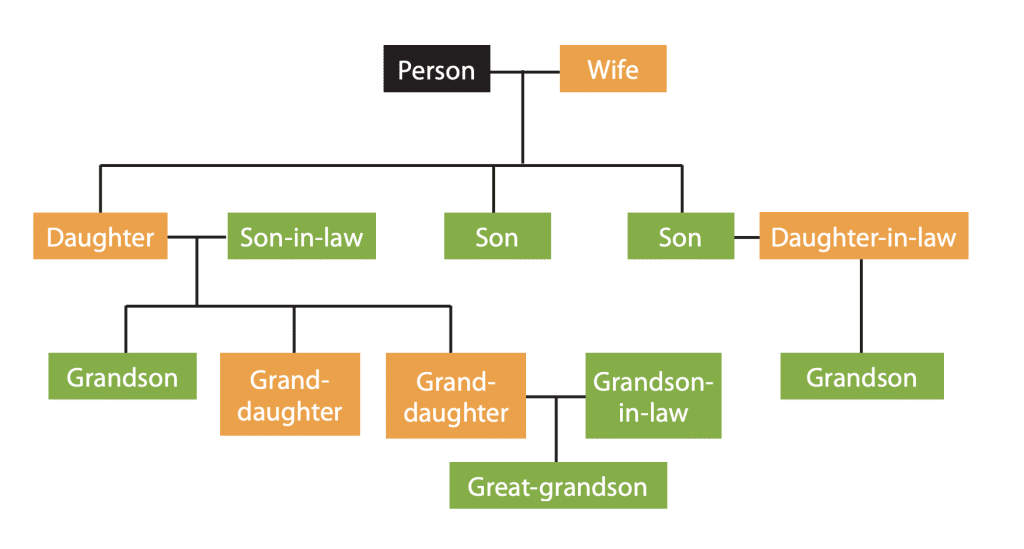
- The standard version is more compact and shows the starting individual at the top and descendants branching off downward, more like the example below.
Family Group Record (or Sheet)
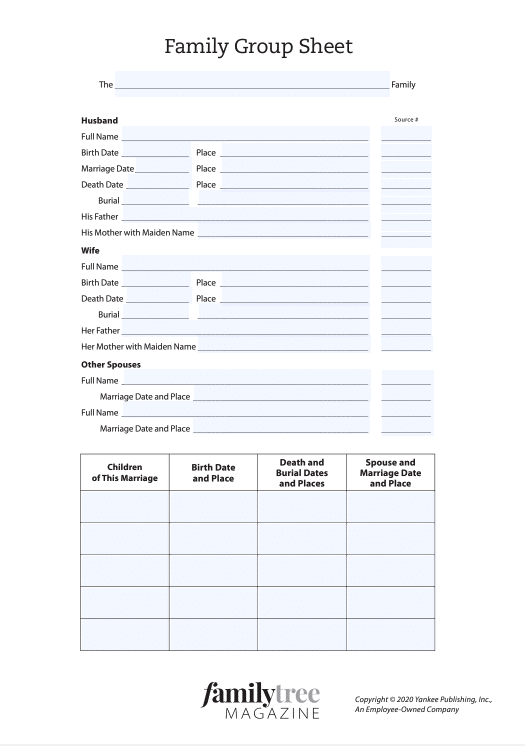
Succinctly summarizes your information on a couple and their children. Includes names; dates and places of birth, baptism, marriage, death and burial; and source citations. Arrange these sheets by husband’s last name in a three-ring binder for easy reference at home and on research outings.
Family History Report
Generations’ Family History Report is a book-form descendant report. It’s something like a Register Report (below), but uses a more confusing numbering system. You’re better off using the more standard Register Report.
Fan Chart
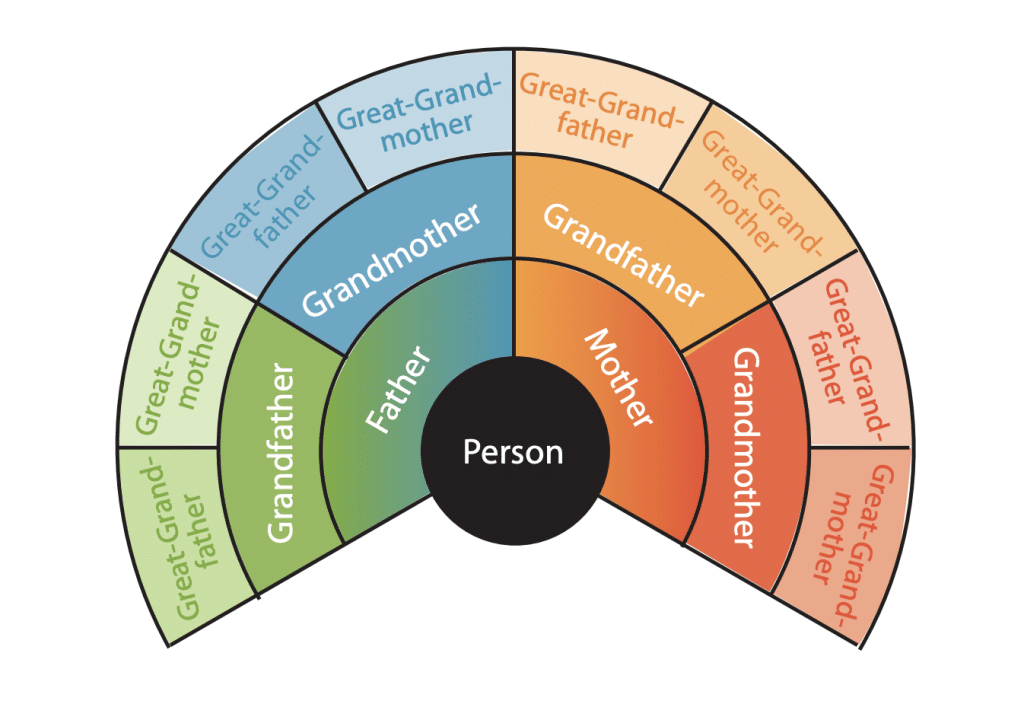
Shaped like a circle or semicircle with the starting individual in the middle. A generation of ancestors or descendants appears in each circle moving outward from the center. A fan chart takes up more space than a standard chart, but makes it easy to visualize which branches are missing from the tree.
Genealogy Report
A narrative history showing the ancestors or descendants of the starting person. Ideal for publishing all your information on an individual’s ancestors or descendants in book form. Choose from three numbering systems: Register or NGS Quarterly (Modified Register) for descendants or Ahnentafel for ancestors.
Hourglass Tree
The starting individual appears in the middle with parents and grandchildren above and children and grandchildren below. The best chart for showing one person’s ancestors and descendants.

Kinship Report
Features an alphabetical list of names and each person’s relationship to a selected individual. Lets you quickly see how anyone in your file is related.
Life Bar Chart
These timeline charts in Genelines show important milestones over the course of a person’s lifetime. You can add historical perspective by including national and international events.
NGS Quarterly Report
Identical to the Modified Register Report, this is a narrative report showing an individual’s descendants arranged by generation. This uses an alternative numbering system to the Register report (below). Every child in a family gets both a Roman numeral and an Arabic numeral. A plus sign indicates that a child appears as a parent in the next generation. Both the NGS Quarterly Report and Register Report make good books.
Outline Descendant Tree (or Chart)
Shows a person’s descendants in a compact outline format without boxes. Each successive generation is indented a little farther to the right. Since it uses a lot less paper than a comparable tree chart, this works well in a family history book.
Pedigree Chart (or Ancestor Chart)
Usually shows between three and five generations in tree form on a letter-size sheet of paper. Like family group records, pedigree charts are useful “at-a-glance” summaries of what you know and they should go in your three-ring binder on research trips. The closest thing to a standard pedigree chart in Family Tree Maker is a “book layout” ancestor tree.
Register Report
A narrative report showing an individual’s descendants arranged by generation. All children in a family get Roman numerals (i, ii, iii …) and every child later listed as a parent also gets an Arabic numeral (2, 3, 4 …) so you can easily trace a family line from generation to generation.

Timeline Chart
This chart in Generations uses bars to show each person’s life span so you can see at a glance who was living in a certain year and whose lifetimes overlapped.
Tiny Tafel Report
For each surname in an individual’s ancestry, the Tiny Tafel Report shows the Soundex code (which groups together similarly spelled names), the range of years when individuals with that name were born and where the earliest and most recent births occurred. This report in Generations is a handy summary of the surnames, time periods and places you’re researching.
Waterfall Chart
In addition to the Top-To-Bottom and Left-To-Right format for descendant charts, Generations’ EasyChart gives this option, with descendants cascading down from upper left to lower right. Choose whichever design you think is the easiest to understand and fits your display area.
A version of this article appeared in the June 2002 issue of Family Tree Magazine. Last updated November 2020.


