Q: How can I use the migration groups/Communities at AncestryDNA?
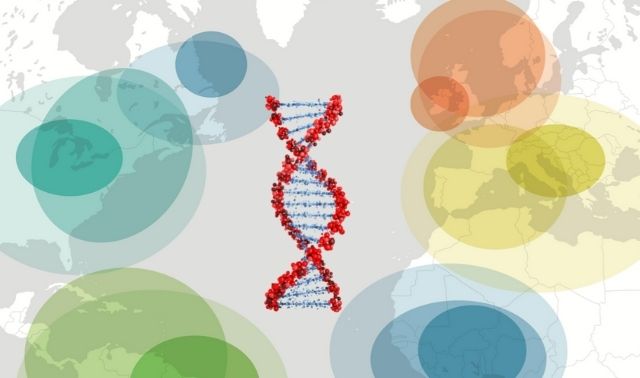
A: Wrapped up in your ethnicity results at AncestryDNA are two very different kinds of information. The first—broadly referred to as your ethnicity estimates—is similar to what you will find at other companies. But Communities, oftentimes nestled under a specific region (e.g., “Germany & the Midwestern United States” under “Germanic Europe”) and represented by the dotted lines in the map and table, are unique to AncestryDNA.
There are four characteristics of these Communities (formerly called “Migrations”) that make them useful in your genealogy research:
Match-based
Communities are based on a different kind of genetic analysis than your ethnicity estimate. Your membership in a particular Community is based on your relationships with other test takers from a region, rather than (as with ethnicity estimates) how you relate to a preselected reference population. Click on a Community to view the Overview page, which will list your DNA matches who are also in that Community, sometimes helpful in determining your connection with your matches.
Accurate
Communities are extremely accurate because of this relationship-based methodology combined with user-generated pedigree charts. Even though some pedigrees are inaccurate, DNA matching and algorithms ensure you can almost guarantee you have an ancestor from that place if you find yourself in a Community.
Recent
Communities are meant to reflect your recent heritage. Click on a Community to view the Overview section, which has an interactive timeline from roughly 1700 to 1900. Clicking through the timeline allows you to learn about the Community at each of those intervals, which could help you piece together more about your ancestors’ lives.
Geographic
Your Community tells you not just where your ancestors may have settled, but where they may have come from. This makes the data useful for tracing migrations, both from Europe and within the United States. For example, my research is stuck in Kentucky, but I’m in a Community of individuals who live in Kentucky but came from Virginia. With that info, I can consider researching in Virginia (as opposed to, for example, North Carolina).
If you aren’t yet a part of any Communities, you probably will be someday. This is a huge area of emphasis and research for Ancestry. While initial Communities were mostly for Americans, the company launched 225 new Ancestry Communities in 2019 that focused heavily on Canada, France, the United Kingdom, Australia and New Zealand.
If you are already in at least one Community, spend some time clicking around this area of the site. So many tools here are worth exploring
A version of this article appeared in the December 2019 issue of Family Tree Magazine.
Understanding How AncestryDNA Communities Works
In April 2017, AncestryDNA launched an unprecedented new feature: Genetic Communities (now called “AncestryDNA Communities”). The goal of this tool is to identify a smallish geographic region where your ancestors actually walked, lived and breathed between 1750 and 1850. This is a specific and ambitious goal. It’s also—potentially—much more genealogically useful than percentages from here and there.
Often, the key to identifying your ancestors isn’t just their names, but also the places they lived. Knowing their village or town can help you distinguish them from others of the same names living during that time. The place also may have been home to other relatives. And of course, the history and culture of places they called home can broaden your understanding of your family’s unique story.
The allure of identifying your ancestral homeland also can be emotional. In fact, the desire to “know where I came from” has already driven millions to take DNA tests. They want to see their ancestral ethnicity estimates: pretty pie charts showing the areas of the world their ancestors once called home.
However, as many of you have already discovered, ethnicity estimates often fall short of expectations. Some places in your pie chart may not correspond to your family tree. And your ethnicity breakdown is unlikely to help you determine where your great-great-grandmother Matilda was born. The geographic origins provided by DNA tests of the past few years have had extremely limited genealogical value.
To get the most out of your Communities, you’ll need to understand how you became a part of them. And that will require just a bit of science, as well as some exploration of the AncestryDNA website. Whether or not you’ve already tested with AncestryDNA, we’ll tell you what this tool can reveal about your family tree—and what may yet be in store.
DNA and SNPs: The great divide
Ancestry.com requires three key components to build its Communities groups: First is enormous numbers of DNA samples (good thing about 2 million users consented to have their data included in the initial research). Second is the online family tree data that’s linked to those DNA samples. Third is a really smart bunch of computers that can identify connections among the samples and people.
The super-smart computers first divide everyone in the site’s DNA database into groups of related people based solely on their DNA, not their family trees. The system identifies several tiny pieces of DNA called SNPs (pronounced “snips”) in each person. Then it compares SNPs across people to see who shares enough DNA to have a common ancestor. Those who share the same SNPs form a network.
This dividing process continues again and again, creating smaller and smaller groups until no additional subgroups can be detected. There isn’t usually a perfect split because many people have genetic overlap in multiple groups. In these cases, the system chooses the best option: Does this person more closely match one smaller group or a different one? Remember that the system is still comparing only people’s DNA, not their family trees.
To become more genealogically useful, though, these little clusters of related people now need to be identified with a place. So Ancestry.com next adds data from family trees associated with these people. But they don’t simply place ancestral birth locations for each person on a map. They also use fancy math to give preference to locations that are more associated with this particular community than any other.
The resulting smart map—fueled by data, super computers and calculations—was published in the scientific journal Nature Communications. When the birth locations for ancestors of each person in the network were added to a map, it revealed that one genetic community contains individuals who all have ancestors from the North East; another has ancestry from the South. Acadians clustered together in Louisiana, while French Canadians were in Quebec. The map displays migrations westward for Pennsylvania and the Lower Midwest, Appalachians and the South.
These results may seem unimpressive at first. Don’t the history textbooks already tell similar stories? Most people know that migration in the United States generally moved from east to west, and that certain groups settled in and migrated to certain places.
But before you declare these Communities to be old news, remember that this clustering of people is based solely on genetics. These Acadians and Southerners declared themselves as such not by their surnames or their locations, but by their DNA. That’s what landed them in these groups. The addition of place tags from family trees came later, to try to identify why this particular group of people were so genetically connected. If you don’t know your family origins—or even if you do, and you’re interested in finding others who share your ancestry—Communities can provide that revelation.
Analyzing DNA: Back through history
Your first step to “joining” an AncestryDNA Communities group is take an AncestryDNA test. Because Communities are based on your DNA, you don’t have to link a family tree to your test to be placed in a Migration group. But linking your tree will let you see which ancestors are the probable links to your Communities. From your AncestryDNA home page, click Settings, go to Family Tree Linking, select a tree, and identify yourself in that tree (or identify the DNA test subject, if it’s not you). To find your DNA home page, log in to Ancestry.com, click the DNA tab and choose Your DNA Results Summary.
When AncestryDNA analyzes your test results, it automatically assigns you to any of the 300-plus Communities your DNA says you should belong to. To find this information, go to your AncestryDNA home page and click Discover Your DNA Story. Here, you can explore both your Ethnicity Estimate and Communities groups.
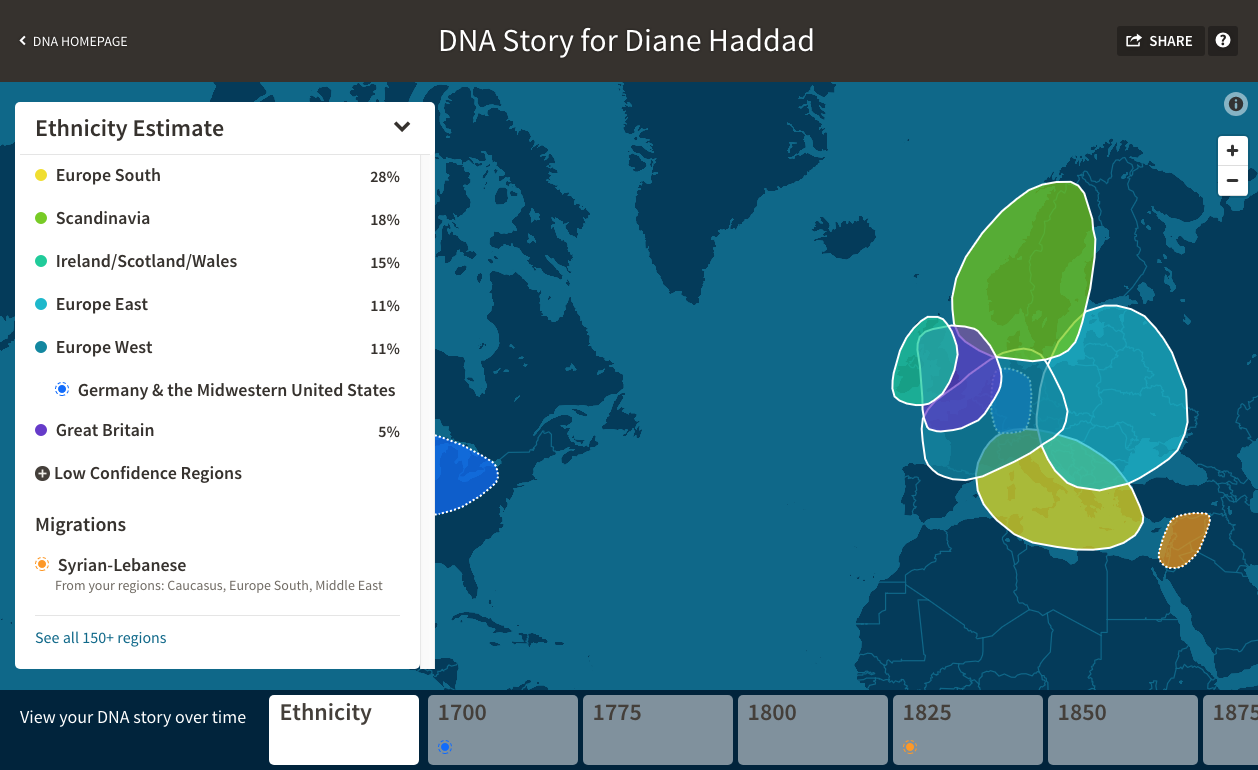
When it switched from “Genetic Communities” to “Migrations” (now to “Communities”), Ancestry DNA also reorganized these pages to visually blend information about ethnic origins with information about your family’s Communities. The initial view displays a box on the left that lists both your ethnicity estimates and your Communities groups Image1. The map shows colored blobs that indicate your ethnic origins (with solid white borders) and your Communities groups (bordered in dashed white lines). If you don’t have any Communities, be patient: As the DNA results database grows and more results are analyzed, new Communities will gradually form. You’ll automatically be added to any that apply to you.
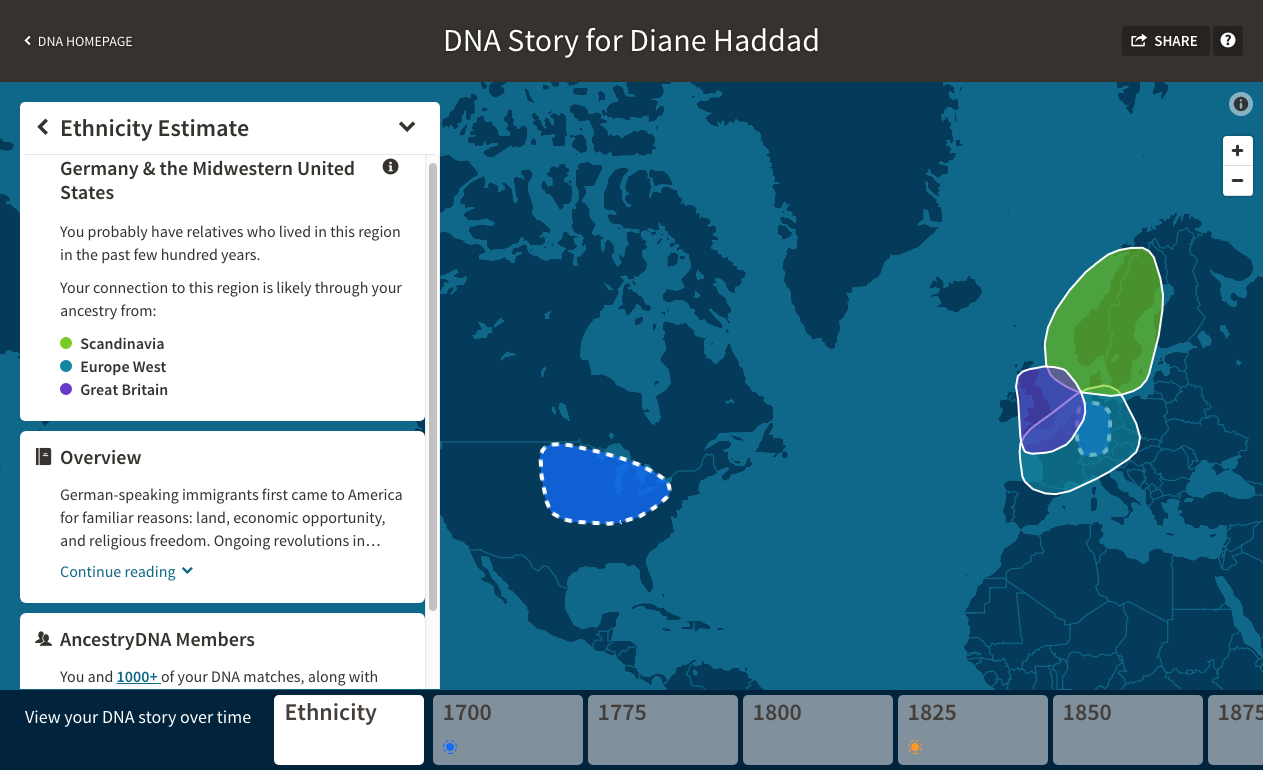
Now, click on one of your Communities blobs on the map or the name of a Communities group in the panel. The panel on the left now displays the name of the group, an overview of its history, and your ethnic origins that likely connect you to that Migration Image 2. Note the i in a circle icon in the top right of this panel. Click this to see a simplified report of how closely you match this Communities group. Your connection score will range from Very Likely (95 percent accuracy) to Possible (20 to 40 percent accuracy).
Click Learn More to link to a page with information on the science behind how you’re assigned to Communities (at press time, still called Genetic Communities on that part of the website). If you scroll down in the panel, you can see how many of your matches have the same Communities. Click the number to open a new browser tab with your match list, filtered to show only those matches.
Next, look at the timeline boxes at the bottom of the screen. These give you access to the story, in general, of your genetic ancestry over time. If you’re in any Communities groups, you’ll see a color-coded dot in the block representing the time period during which your family tree (the one that’s linked to your DNA test) first has the names of ancestors whose birthplaces are associated with that group.
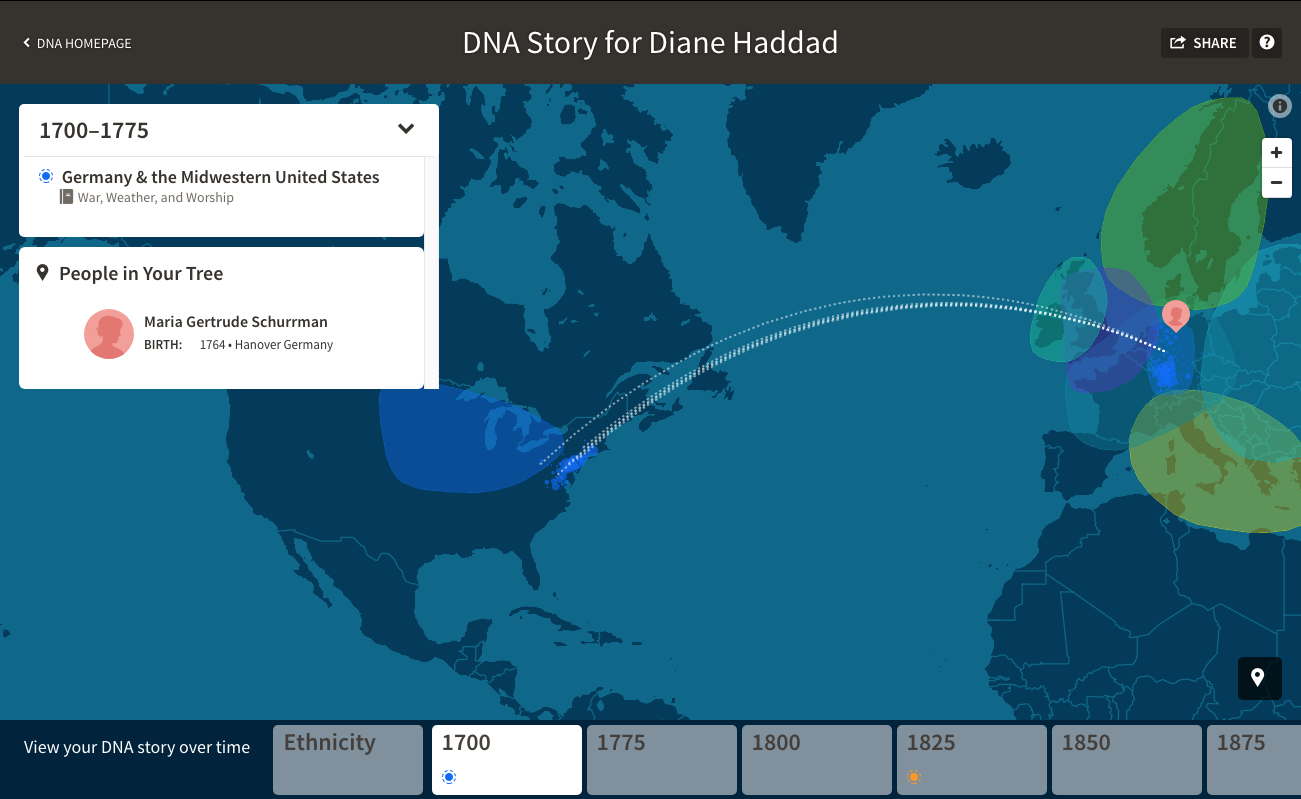
Click one of the Communities timeline boxes, and the panel on the left side of the page changes to give you historical information on your ancestors’ Communities during that time period Image 3. (You may need to click the down arrow at the top of the panel to expand it.)
The transparent colored blobs that show your estimated ethnic origins are on this map, too, but more transparent. Focus on the blobs that are color-coded to match the Communities groups that apply to your family history during the selected time period. These blobs show the locations of your Communities groups at the time, with bigger blobs representing areas that have a higher population from that particular group. In image 3, for example, the blue blobs show the origins of the Germany & the Midwestern United States Communities group, as well as the locations of the group in America between 1700 and 1775. As the AncestryDNA collects and analyzes more information from test-takers, the sizes and locations of the dots may change.
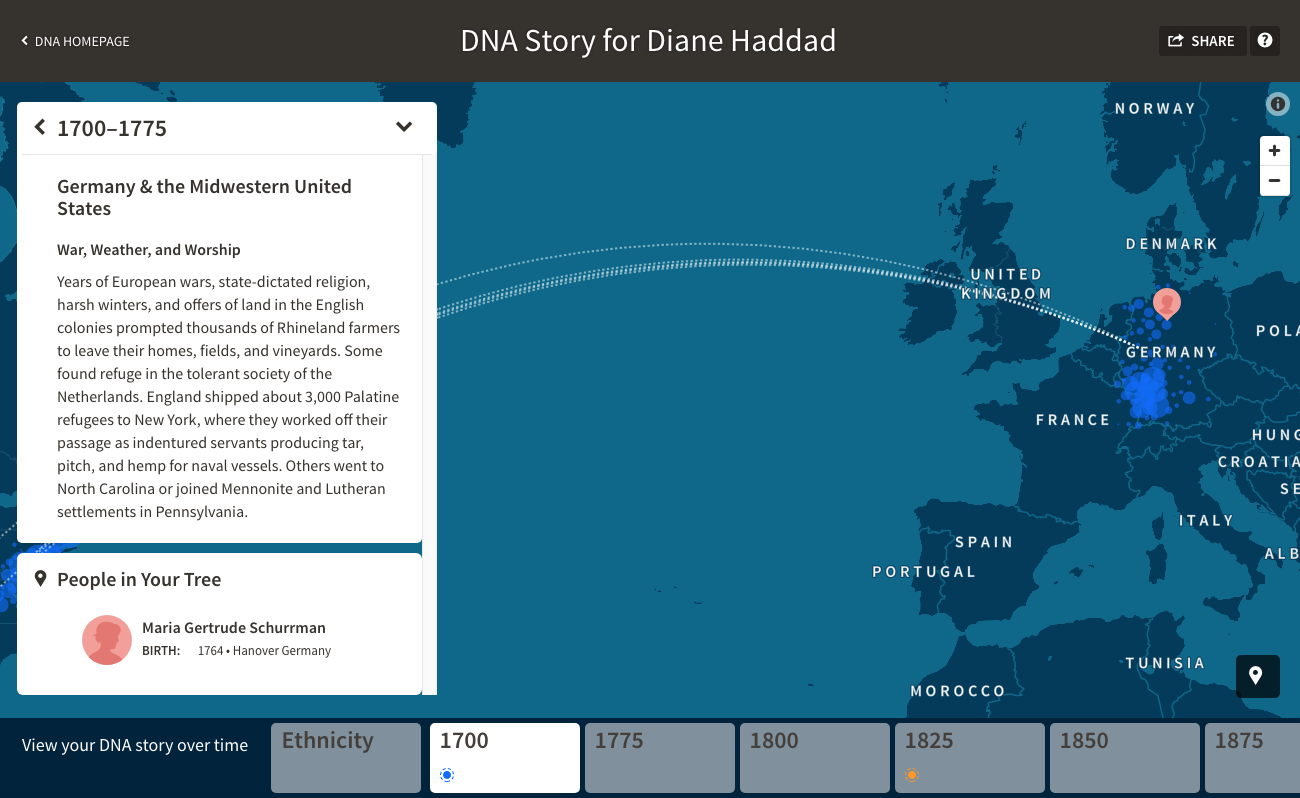
Click the name of a Communities group in the panel, then click any subheads to read about its history during that time span (Image 4). You’ll also see the names of your ancestors living at the time who likely are associated with this group. Your view of the map changes, too: Pointers with profile icons (or numbers, in the case of multiple ancestors) show you birthplaces of those ancestors, taken from the family tree that’s linked to your DNA test. Click the pointer to see their names and basic information.
Finally, white dashed lines connecting the colored Communities blobs show general migration routes of the group. Remember, these colored blobs and routes are based on data from the family trees of test-takers whose DNA put them into that Communities group.
AncestryDNA Story: Making connections
We talked about how to link from the DNA Story area to view your genetic matches who’ve been placed in the same Communities groups as you. Here’s another way to view those matches without going through your DNA Story: Go to your AncestryDNA home page and click the green View All DNA Matches button. This shows all your DNA matches, from closest to most distant. Next, in the filters bar, click Genetic Communities (that was the label on this button at press time, but look for it to change to become consistent with the new Communities moniker).
If you have multiple Communities groups, you’ll be able to choose one from a dropdown menu. Once you’ve done that, your match list will adjust itself to show you only matches who are in that Migration with you. This is a helpful way to narrow down how you’re related to people: If your paternal and maternal sides are from different places, just knowing that a match is in, say, your New England Communities group instead of Tennessee could at least help you narrow down how you’re related to that person.
If you have hundreds of matches who belong to the same Communities group, this might mean the group itself is fairly broad. Another possibility is that you have multiple ancestors from this area—a common situation, as immigrants form the same areas tended to settle together and intermarry.
You used to be able to see common last names from the family trees of your Communities group members, but AncestryDNA has done away with this feature.
Using a combination of the map and timeline views, you can begin to piece together information about your ancestors. Let’s say you’ve exhausted all local research options looking for the parents of your ancestor Belinda Monroe, who was born in Kansas City, Mo. Take a look at your Communities. Perhaps one is Early Settlers of the Lower Midwest and Virginia. While this is a large area, you can see that many of those who moved to the Kansas City area originally came from Kentucky, and before that, Virginia. Now you have a possible migration route to follow in looking for Belinda’s family.
AncestryDNA Communities: What’s next?
Explore each Communities group you’ve been assigned to, especially those that show high confidence scores. I recommend clicking through the timeline chronologically. During each era, note the historical information about your family Communities, as well as the names of ancestors who are associated with those migrations. Examine the map, which you can zoom in and click on, and compare it to what you’ve discovered through your research.
You don’t need an Ancestry.com subscription to view your Communities. If you click to view a match’s Ancestry Member Tree, though, you’ll be prompted to subscribe. If you’ve had parents or aunts and uncles test, ask to explore their Communities as well (they can share their DNA results with you under the settings area of their AncestryDNA home page). Because they’re closer to the migrating generation, they’ll have stronger confidence scores and may be in Communities groups you’re not.
If you find your interest piqued, redouble your research efforts relating to the ancestors who “qualify” you for each Communities group. Expand your reading about historical migration patterns beyond the summaries Ancestry.com provides. Use the AncestryDNA messaging system to contact any close matches who also are assigned to your Communities. You could say something like “Looks like we’re both in the Munster, Ireland, Communities group. I’ve learned that means we could share an ancestor from that region. Even if you don’t know of any ancestors from there, maybe we could work together to find them.”
Follow clues in migration patterns, in historical events, and in DNA matches. You might test other relatives from family branches that place you in Genetic Communities of particular interest (or that didn’t lead to your assignment to a Communities group you expected you’d be in).
What you should definitely do is get excited. Communities herald a new era in family history, one that brings together genetic and genealogical knowledge with increasingly powerful and precise results. Tools like these, when well-understood and carefully applied, can help you find your family’s place in history and illuminate your ancestors’ lives.
Bonus: How Communities Are Created

1. Migrations group people based on shared parts of DNA called SNPs. To symbolize how this is done, we’ve grouped a broad category of items: Things you could purchase at your favorite big-box retail store. Items you can’t buy there—a car, a house, a tiger—are excluded.

2. Let’s further divide our purchases into three groups of closely related items: school supplies, household goods and everything else. Note that some purchased items may fit into two groups. For example, you might find pencils and books both at home and school. Similarly, a given SNP might occur in two Communities groups, but we’ll choose the best-fitting category for them.

3. Now, let’s subdivide our items into even narrower groups: writing implements, books and everything else. We could continue, sorting pencils from pens, red pens from blue, until no meaningful subdivisions remain.
Once we have the smallest possible grouping, we can pretend that pencils and books have family trees, and note birthplaces that most often occur in the trees for each group. This lets us plot the movement of each group over time.
From the January/February 2018 issue of Family Tree Magazine.


